We are pretty much aware on how useful conversion rate optimization tools are.
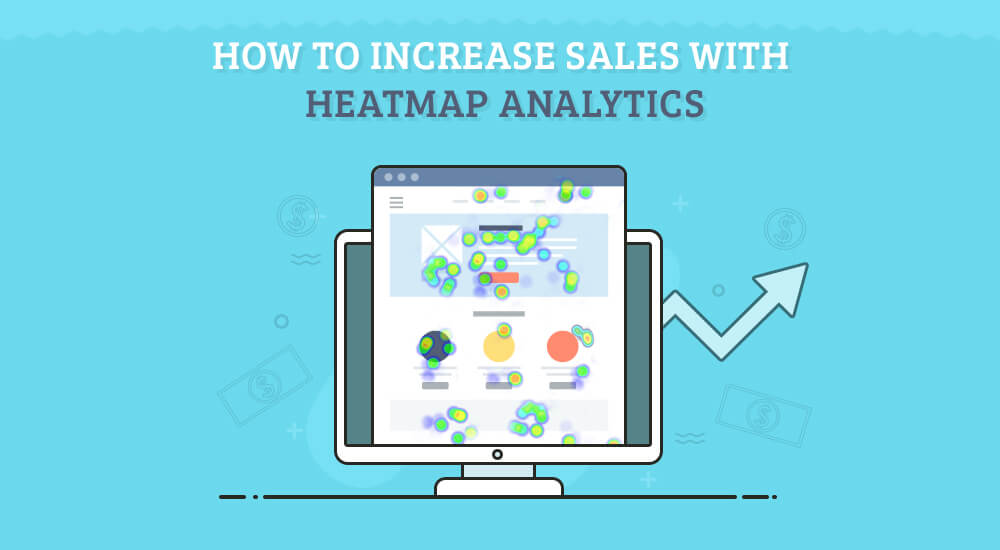
And as you know heatmap is one of those amazing tools which lets you track your visitors activity and boost your conversions by unbeatable margins.
The Best Part:
It is not only about tracing the visitors and having an eye on what they do. But it gives you a lot more information to dig out from.
The tool allows you to observe the whole activity a visitor is having on your website and to make changes according to the user demand. In fact the later part is the most effective because that is what will fulfill the purpose of heatmap.
Now with the use of heatmap analytics, we are able to work on the website’s layout, design, navigations and the areas which are not attracting or basically distracting the visitors.
Today, this post is going to take you through a small journey on how heatmap is going to benefit your website performance and eventually your conversions with all the tweaking you would do after setting up a heatmap.
Let’s first know a little bit about heatmap analytics first!
Contents
How do Heatmap Analytics help in Boosting Conversions?
Heatmap Analytics offer different kinds of tracking tools. Heatmaps offer categories like mouse tracking and eye tracking. Different maps offer these trackings.
The map kinds include hover map, scroll map and click map; all of these let you track the visitors in different capacities.
Let’s discuss these one by one.
Hover Map:
Hover map is a kind of heatmap which shows the mouse movement of the visitor. It is often called mouse mapping. Some areas have more movements, some have less. The areas with higher movement are represented by the red color.
Through this, you can have an idea of where your visitors are mostly paying attention on your site. And it will help you work on that area and further improve your conversions by tweaking that particular area.
Check below how does TruConversion’s Hover map exhibit the results and tell you about the area with more activity.

The red part show the area with the highest activity. With these maps you can see the areas which grab the most attention by your users.
Scroll Map:
Scroll map also tells you the visitor’s activity. It basically guides you on deciding the page length and how you can put the important things on your page optimally.

Scroll map gives you a chance to decide which length works the most for you, where does your visitors actually stop and which strategy to adopt; whether above the fold or below the fold.
Here for example, the Nielsen Norman Group has found out that 80% of its visitors spend more time above the fold.

Click Map:
Click maps exhibit user activity in the same manner. The difference is just that it mainly tells you about where the user clicked the most. Which areas or which buttons specifically attracted your user’s attention.
This is quite beneficial as it can guide you on which CTA buttons are working for you and which are not.

Check how it is shown in the image above. This is TruConversion Blog. Click map shows where the readers clicked the most.
Let’s go through some Striking Heatmap Analytics Case Studies:
The studies that I am going to mention now are few examples of how heatmap analytics help you optimize your site and boost your sales with unexpected margins.
Tracing your visitors and observing their interaction with your site helps you see what is working for you and what is not. Helps you optimize your site!
North Face Case Study:
North face, a online shopping store, A/B tested to see where does its checkout page actually lagging behind and not getting the desired sales.
After setting up the heatmap analytics on the previous and the edited page, the difference was observed and they analyzed that placing their main ‘Add-to-Cart’ button above the marketing banner gained much more clicks than before.
Previously the attention was going on the banner instead of the main buying button.
Changing the button placement raised around 12% of conversion.
Dennis Publishing Case Study:
Dennis Publishing wanted to check that which side of its website attracts more visitors and where do the visitors click more. After figuring out that the left side had more traffic, they moved their Google Ad to the left side.

This change resulted in an increase in the click-through rate by 44%, thus improving the conversions.
Optimal Energy Case Study:
Optimal Energy also applied heatmap on its site to see where its visitors are going and why its conversions are not increasing.
It figured out that that the slider they have put on their site is making their visitors leave as the CTA buttons shown on the slider are non-clickable. Hence, visitors find it frustrating to click on the CTA button and not being able to do any action.
Optimal Energy changed its layout, optimized it. It turned the slider into a proper web form and put the relevant CTA button on it. This increased the conversions by 122,6%.

SugarRae Case Study:
SugarRae applied heatmap on its site and figured out that most of the users are clicking on the non-clickable areas. In this way the site placed all its ads and CTA buttons on the places the users are clicking the most. This helped a lot in boosting the site’s conversions.

Another Case Study:
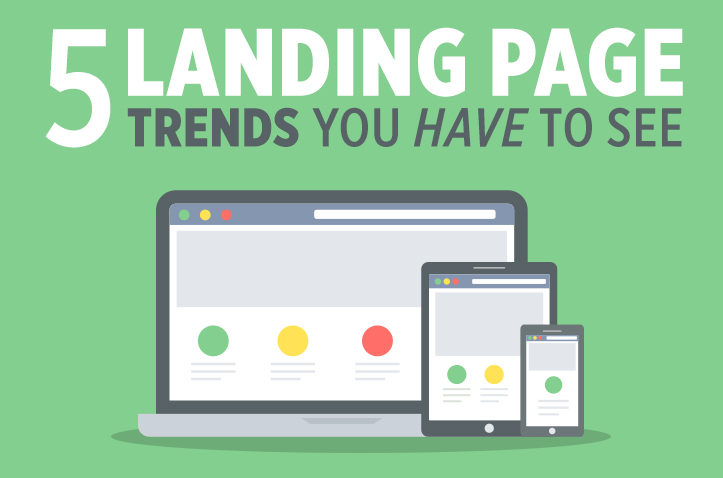
Here is another case study over landing page optimization which figured out about how images affect your landing page conversions. The study showed that the images which show human emotions convert the most, especially with the real- life pictures.
Secondly, images also have further preferences. Images that show excited, happy and expressive human photos, bring the most conversions.
For instance look at these three photos below, the second one brought the most conversions on a landing page.

Conclusion
I’m sure these examples are enough for you believe how we can boost our website conversions and increase sales by using Heatmap Analytics.
These case studies are the perfect exampleS for you to build trust on these conversion rate optimization tools.
TruConversion is an extremely useful application which offers you Heatmap Analytics and helps you track your visitor activity and make your site far more convertible with tweaking and optimization.
For more details on how you can install these Analytics, check this amazing post on HOW TO OPTIMIZE YOUR WEBSITE AND INCREASE YOUR PROFITS along with great Case Studies.


One Response
I didn’t really know people spend more than 80% of their time above the fold. A handy stat I will be using a lot from here on out.
Comments are closed.