What would you do if you want to buy a pair of jeans?
Would you just go online and look at the number of people who bought the new skinnies in the market and would simply order it? Or you would actually go out, see which styles are there, try them out and see why is it worth buying?
There has always been a confusion on whether to simply see the stats or wait and observe something in detail. And the confusion is a difficult one to solve, indeed!
While performing any kind of task, a prior or ongoing research is very important at each and every step. Now the real question is what kind of research should we go for; qualitative or quantitative.
Similarly, observing your website’s traffic requires both quantitative and qualitative analysis. We need to track all the steps taken by our customers while they are browsing our site.
Because tracking the customer’s activity is as important as noting down the number of times he logs on our website.
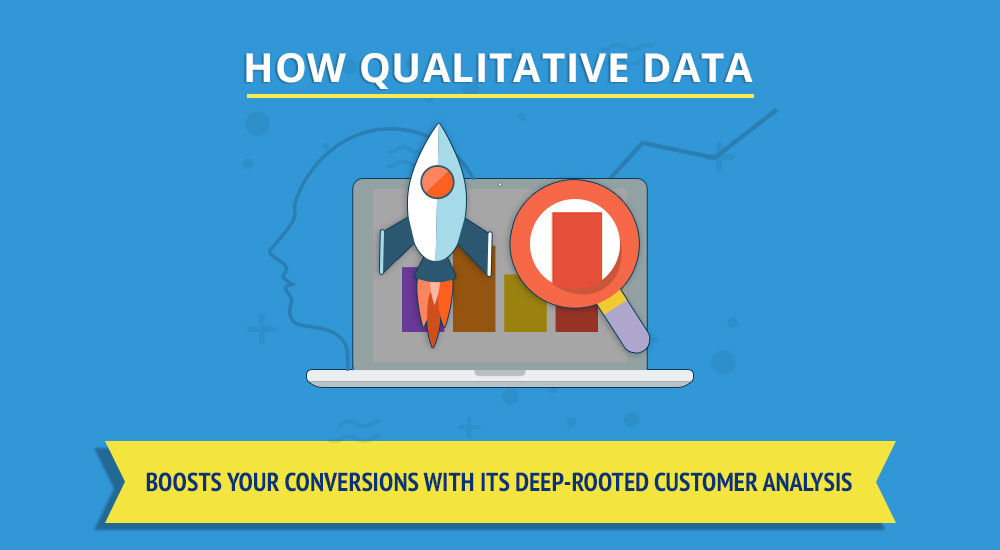
This post is going to take you through some of the most amazing insights on how qualitative and quantitative data work together and why qualitative data should never be underestimated.
Contents
What actually differentiates Qualitative from Quantitative data?
Qualitative data is more like a product of an exploratory research. It provides insights to the underlying reasons and details. It helps to dive deeper into the problem by observations and close study.
This kind of data tends to be descriptive in nature, leading to a narrative flow.
It gives you a detailed analysis. For instance, session recordings provide you with the exact mouse movement that the user does on a particular site, it shows how does the user move along the site, what grabs the user’s attention and what is the sequence of the user’s choices.
It doesn’t only give the number of users who clicked on a particular CTA button but shows how he actually reached that button.
So this gives you a clear idea of how your site positioning is working for the users, what you need to rectify and what is being beneficial for you.

On the other hand, quantitative data is used to quantify the problem by generating numerical data or statistics.
It quantifies opinions, behaviors, and generalizes results taken from a larger sample of population. It basically uses measurable data to generate facts, certainly precise stats and ends up giving a concrete analysis.
These are just numbers, which will give you the number of people who opted for a particular service at your site, but this wouldn’t tell you the reason.
These are just stats and numbers that you can quote further and tell how many people performed a particular task.
The numbers can be used to show a percentage or proportion but won’t tell you any proper reasons behind it.
Must have heard about Big Data… What’s the hype all about?
You might have heard the term, ‘Big Data’, time and again but very few of you would have actually gone far and looked into it.
Big Data is basically large data sets which give you patterns and trends related to human behavior and activity.So this clearly depicts that ‘Big Data’ is directly related to the qualitative research which is descriptive and detailed.
Most of the people think that they can do well with the quantitative research alone and that there’s no need to have a detailed observations on anything.
But:
The numbers and analytics cannot do anything alone and we really need to do exploratory research at certain times, especially in the present era when analytics have gone way ahead.
Now:
Big Data might just sound as a buzzword but it certainly has gain immense importance because people have recognised the need for qualitative analysis to a great extent.
Other than just having a sheet full of numbers and stats, companies want to observe their visitors, track and trace their activities and eventually increase the website conversions through these observations.
The best part of the qualitative analysis is that it provides you with a ‘focused user experience testing’ which is almost free of generalization and ambiguity.
Furthermore:
Big Data allows you to have tons of trends and activities giving you the whole picture of what your customers are doing, what they like and what they dislike. The game has certainly gone far then reading numbers and processing them only!
A recent study which involved 540 participant companies, showed that 77% of organizations are considering Big Data analytics a priority and making decisions based on that. So my friends, it isn’t just a trending word now.
This kind of research basically connects you deeper with the customer. The qualitative data gives you a chance to see in detail what customers want, how do they go about your site, where they stop and from where do they checkout.
This ability gives a chance to alter the user experience as per their demands.
Marissa Mayer from Google, tested the user experience and later she could feel the emotion many users felt while using Google. This testing was a big reason why Google always focused on pagespeed for its products.
This is what Big Data or the qualitative data is in usual terms, it allows you to observe and alter the things which are decreasing your conversions.
You might be wondering:
Website conversion has mainly to do with your website design, layout, CTA buttons, web forms or the whole checkout process…. So what’s the role of the qualitative data in increasing conversions?

Here’s the Kicker:
Qualitative data is one of the major data sources which lets you observe and track your visitors and design your website in a way which brings many more conversions than before.
Adding convertible designs, layout, buttons, forms or checkouts might be of use too but the qualitative data allows you to see what exactly is happening on your site. What customer require, where do they move around, what are they looking for and what are the reasons which make them leave your site.
What could be more amazing than this?
If you’d actually know what’s turning them off, you’ll be able to change it immediately with something that would convert more than ever!
The Magical Tools which help in collecting the Qualitative Data
Here are the main tools which help you gauge out Qualitative Data on your website:
1. Heatmaps:
Heatmap enables the website owners to gain a better understanding of how visitors are interacting with their website. These tools disclose where people are clicking which determines what elements are converting and what are not.
Heatmaps helps in analyzing the behaviour and activity of your visitors. This tool makes you realize instantly where to put your best call to action buttons and offers.
Heatmap basically shows you the whole customer interaction with these colored spots, where the visitor took the mouse, where did he click and from where did he leave. This visitor interaction allows you to analyze various aspect of your site.
There are two kinds of heatmaps; eye tracking and mouse tracking. Most of sites use mouse tracking heatmaps. TruConversion provides its users with various analytical tools and Heatmaps is one of the main tools which give amazing insights about website visitors.

Here are the main types of Heat Maps used by the website nowadays:
- Hover maps are also called mouse movement tracking. They exhibit areas of your site where people hovered over with their mouse cursor.

- Click maps show aggregated click data, which expresses your user’s intent in a much better way than showed by hover maps. Clicking shows that the visitor has the intention to move further through the conversion funnel.

- Attention heatmaps show you how much attention a particular portion of your site received from your visitors. It shows which part is attention-grabbing, where people click the most and how much time do they spend on any part of the site.
- Scroll maps show how much are your users willing to scroll down through your page. White, yellow and red colors show the areas of a page that received the most attention and green and blue colors show areas that were least viewed.

Here are the reasons you should use Heatmaps:
Positioning the content- You can see where the customer clicked the most or took his mouse to. So that is the place where your most important content should be placed at. There are two places where you can place your content; Above the fold or Below the fold.
A case study called, ‘Scrolling and Attention’ shows that 80% the users only look at above the fold content and leave before reaching the below the fold part, very people scroll the page down and reach the end of the website.
Make it stand out- The important thing in your website should be bold enough to be picked up by the customer. A study, ‘What you see is what you buy’, conducted by EyeQuant Neuroscience revealed that the consumers are more likely to choose the option which has a higher visual impact.
Follow the F-shaped pattern- Heatmaps reveal a fact that people read your content in a F shape. They read it horizontally from left to right.
Here is what Coleman also found out in an attention map of one of their pages.

Avoid automatic images for better clickthrough rates- A study, ‘Banner Blindness: Old and New Findings‘, conducted by Nielsen Norman Group shows that the animated image reduce the clickthrough rate of a site.
Combining A/B Testing with Clickmaps- Analysing a site’s function by joining clickmaps with your A/B testing one of the perfect ways. By giving the number of clicks it shows what layout is working more. You A/B testing becomes far more effective.

Heatmaps and Shopping Cart Abandonment:
Heatmaps can be extremely useful for tracing your shopping cart abandonment. It is a must to put a heatmap on your online shopping site.
Heatmaps would give you a clear idea on which products are your visitors clicking, are they scrolling down, how are they moving about your conversion funnel, what is their reaction when they come on the checkout page, what is exactly making them leave your online store.
Check out this detailed post on HOW TO REDUCE YOUR SHOPPING CART ABANDONMENT RATE?. This will give a comprehensive idea on how you can control your abandonments.
2. Session Recordings:
These recordings lets you see your website from the perspective of a visitor and lets you find out what makes them leave or buy.
You can watch recordings of their individual browsing journey, see where they’re clicking and discover where you’re losing them. It helps in finding problems with the site’s usability and fix them to improve conversion.

This is how a particular visitor session is recorded. It shows the whole mouse movement around the site, shows where the user went, where did he stop and from where exactly where did he leave the site.
Here are the reasons you should have Session Recordings:
- IT Security- as it tracks the activity.
- Easier Compliance Accountability- as it monitors and audit local and remote user activity.
- Remote Vendor Monitoring- as it reviews and searches remote vendor sessions.
- Better End-user Experience- as the instant video recordings, live activity streams, of every user session helps in assisting helpdesk tasks.
3. Microsurvey:
Customer survey is one thing which gives you a detailed feedback on what your customer think about your website, however it highly depends on the kind of questions you ask.
We are living in a digital era and customer service plays a vital role today. Customers require high interaction and they need to be informed and asked at every now and then.
It’s the time for instant replies, quick feedbacks and really knowing your customer inside out.
You also have to form your customer survey in a way which grabs your customer’s attention..
This is how a web Photography app, PhotoShelter, did it:

You do have to consider few things before you design your survey:
- Important Questions only– avoid asking irrelevant or long questions
- Keep it Precise– your survey should be short and to-the-point
- Make it Smart– Construct a smart survey. An open-ended question would also work well, will give you some necessary details.
- Have Consistent Scales– If your survey consists of scales, the make sure they are obvious and not confusing.
- Avoid biases– do not force your customer to answer in a way you want them to answer.
- Have more Yes/No– Yes and No are always the best option without confusion and ambiguity. These are time saving too.
- Timing is highly important– Offer your survey at the time when you think your customer would answer for sure.
- Offer a Perk– Offering your customer some bonus or perk is very important, this is a way you can make them fill out your survey.
4. Live Chat:
Live Chat might sound a very typical aspect of any sight but I’m going to show you some facts which are simply amazing. Live Chat these days, is one of the most important factor that will grab high number of customers.

Times have changed and as the above picture shows, it is more of a Human to Human era now and your customers need your full attention and need to talk to you at every point.
You cannot simply skip through this part of your business.
Having an effective customer service is the best way to promote your brand and convert your customers.

The above graph shows how important ‘Live Chat’ is. The first one is your site’s service, a microsurvey of a feedback form would be part of it.
But the second one is live chat, around 23.1% of respondents prefer live chats, and that’s quite a big number. This allows users to talk directly to the customer service and fulfil the query at that very moment.
Be sure an expert is sitting on the other end who will satisfy the customer, or else it would simply turn them off.
Benefits resulting from using Qualitative Tools
- Constant Feedbacks:
Qualitative data in form of Surveys and Live Chats provide you with a detailed feedback from your customers. It doesn’t only record the number of customers who came, left or stayed but it gives their activity log of how they felt and what did they like about your website.
The detailed answers in your surveys give you a larger view of what a customer wants from your website. Through these feedbacks you can alter your product and build a revised Product Fit.
- Higher Observations:
Observations through session recordings and heatmaps give you a chance of observing and looking at what your customers do on your website. By tracking their activity you can see what is attracting them more and what is not.
This can lead to changing User Interface of your product. When the whole activity will be traced, you can cut out the part which is useless and can focus on what is demanded.
- Problems Identification:
The detailed data which comes out of these qualitative tools make it easy for you to identify the problems at your website. When you would have detailed answers to the survey, the traced activities and recording, it would be super easy for you to trace the exact problem and rectify it as soon as you can.
Hence, the tools are the reasons of shortening your rectification time and increasing your conversion within a short period of time.
Conclusion
Qualitative Data provides you with all the detailed customer demand and customer interaction. Remember:
Numbers and stats are just plain data which do not give you any detail about what exactly is going on with your visitor and your website.
By using qualitative data you can have some extremely useful customer insights which will end up giving you high conversions in a longer run.