In this progressive and technologically advanced era, we see an intense competition in online and offline businesses, both.
And, today retaining the customers and making them your loyal customers has become extremely complex.
You really have to offer something exciting, something different and something really valuable to be the best in the customer’s eyes!
Well, how do you think you can entertain your audience differently when there is so much competition?
In an era where a single new feature gets viral in just a couple of seconds and gets adopted by all 10 other sites by the night.
Well, I think times have changed!
It’s not about really cutting the competitors off but more about remaining in the competition and retaining your customers with bringing constant innovations.
And for customer retention, you have to see what makes them stay for long. What they like and what they dislike.. What excites them and what bothers them.
You think I’m asking you to follow them?
Yes, you’re right!
You need to follow them by tracking their behavior.
How do you think you would be able to track your customer’s behavior?
‘Tracking Tools’??
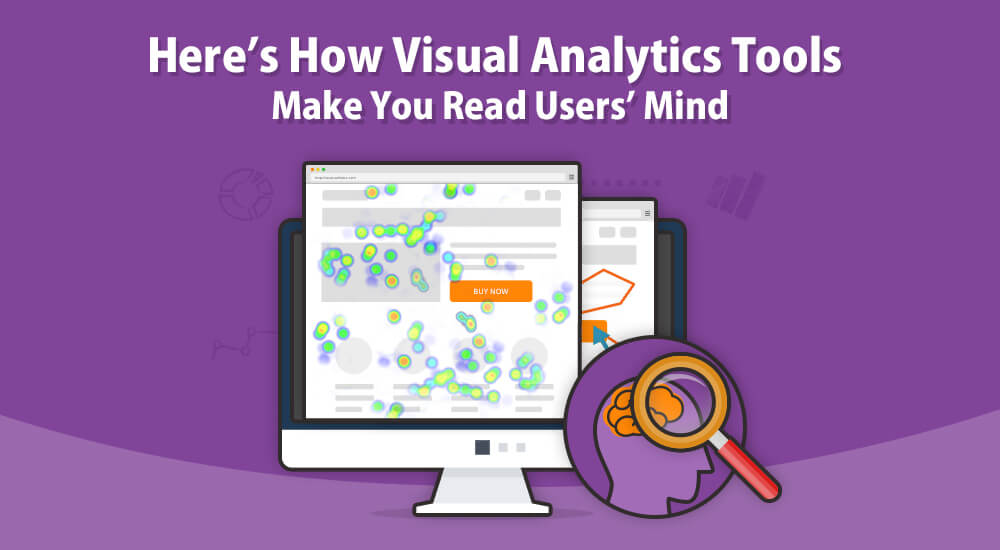
Yes, by tracking tools I basically mean all kinds of visual analytics tools!
This is what we actually need to trace or track our visitors!
And it’s not about just tracking and seeing what do they do…
But actually working on the findings that come out after tracing their behavior. It’s much more about improving and altering your web interface according to the customer’s liking. And catching them right from the point which pushes them away!
This post will talk about the tools which will make you aware of your visitor’s demands.
So, get ready to see some mind blowing case studies on using visual analytics tools and improving your User Experience!
Contents
How ‘Visual Analytics Tools’ help in Web Optimization:
Whenever we say the word ‘Analytics’, it is quite obvious that we are talking about getting some sort of analysis. And Analytical Tools in terms of ‘Web Analytics’ are specifically related to analysing a website and the visitor’s activity conducted on that particular website or a webpage.
Now, why do we visually analyse our websites?
Well, for a million reasons to be exact!
The main reasons might include:
- To check qualitative and quantitative data of your website
- To make continuous improvements in your website according to the visitor’s demands
- To gain a competitive edge over other sites by tweaking your website according to the analysis
And the main benefits of using visual analytics tools are:
- They offer deep understanding
- They offer faster access
- They offer relevant data
- They offer accurate information
- They offer digital reporting
Here’s a BONUS Guide on the Best Visual Analytics Tools for you!
Now:
It is important to note that Visual Analytics Tools gives us a chance to visually observe each and every aspect of a website. There are various tools which come under this category of Analytics, namely:
- Heatmaps
- Session Recordings
Let’s’ discuss the two in detail and dig out on how these can be really useful for your websites:
Heatmaps:
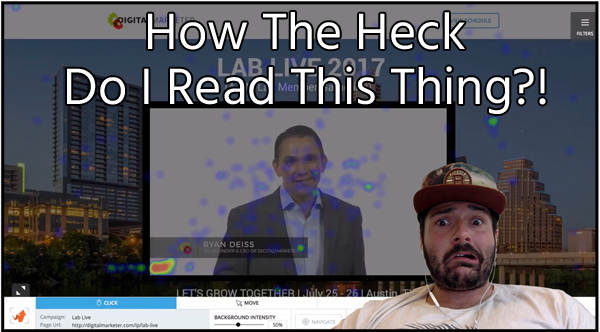
Heatmaps are basically a visual representation of the data at your website. This is one of the most renowned visual analytic tools. It basically allows you to track visitors activity; clicks and mouse movements carried out at your web page.
There are three different types of heat maps:
Hover maps
Hover maps allow you to see the part where the user has moved his mouse the most. The area where there has been the highest activity on the page.
In the picture below, you can see the spots at particular places, these are the areas with the highest activity by the user.
Click maps
Click maps show the area or points where the user has clicked the most. This gives you an idea about the clickable areas if your web page or the areas which are basically engaging the users and making hem clk and move forward.
The picture below is an example of how click map exhibits the patterns or places where the visitors have clicked the most.
Scroll maps
Scroll maps basically show how much the user scrolls down. The color change shows how much did the user actually scrolled. The more change appear in the color, the less user has scrolled down. The change in color basically show that the users didn’t scroll much.

Conversion XL gives a full-fledged review on how heatmaps work and what important elements they reveal.
Some of the significant insights revealed by heatmap are:
- Clicks on a web page
- Areas which are given the most importance
- Headlines which grab the most attention
- Images that attract visitors
- Content which is compelling to the visitors
- Usefulness of the navigation used at the site
Similarly, heatmap also reveal the areas and the elements which are not working in the favour of the website.
Heat Mapping basically disclose all the strengths and the weaknesses of a web page. After putting on heatmap, you are pretty much clear on what is working for you and what is not.
Session Recordings:
Session or Visitor recording is a type of visual analytics tools which give you an upgraded information.
These recordings are in the form of videos which record the whole session of each and every visitor and give you short film of the user’s activity on the web page.
This is a great insight for sure. You will not miss any action taken by the user and see exactly what he did at the site. This will lead to many meaningful change at your site.
Check how TruConversion, an all-in-one CRO application, gives you a great chance to record your visitor’s sessions and observe each and everything about their activity. This application provides a variety of visual analytics tools from which you can completely know what your visitors are doing on your site.

Vocabla is SaaS model business which used session recording on it’s website to see where does the page lacks and to build a more user-friendly page.
It designed a new page according to the problems it saw in it’s pricing page. The new design raised the conversions by 218%.
Check here how conversions can boost by 218% with Visitor Recording!
Case Studies where Visual Analytics Tools did Miracles:
Heatmaps let you have various useful insights which will help you build far more convertible sites.
Bros Leather Supply used a variety of thumbnails with their leather bag in its shopping cart. Later, with the use of heatmap, they figured out that the area with the most attention was the thumbnail part, showing that the visitors wanted to see the product properly.

This is how heatmap discloses the user’s interests and helps the cart designers to design their checkout process accordingly.
Conversion Rate Experts wanted to improve their sign-in form and for this purpose they put a heat map at that very page to see what really is the reason for the low lead generation.
The heatmap led them know that the audience gets distracted by the sidebar content with the sign in form and that was the real reason. Now they tweaked the content to regain the user’s attention, hence increasing the web form conversions.
Softmedia is another company which used heatmap at their site to see where the users actually click. When the company read the heatmap report, they saw what worked for it and made change, resulting in 51% increase in conversions.

Pagely used scroll map to see if their page layout was doing fine or not. They figured out that only 25% of the total users scrolled beyond 600px, thus proving that the rest of the page content is going to waste.
Furthermore, along with heatmaps like hovr maps, scroll maps and click maps; websites today are using a variety of useful visual analytics tools. Tools like Confetti maps, Overlay and recordings are being used to track the visitors and their activities in order to provide them with much better UX.
Conclusion
Now the question is which tools to use. We have some amazing conversion applications which provide effective tracking tools.
TruConversion is an all-in-one application which provides visual analytics tools like heat maps and session recording.
TruConversion’s Heatmap is a super awesome tool which track all the mouse movements of the visitor. Now you are able to trace your visitor’s activity.
With session recording, you are able to see the whole session the visitor spends on your site. Nothing would be hidden and now there’s no more guesswork!!
It is quite evident from the above examples that a set of good visual analytical tools is pretty useful for your marketing arsenal.
It would help you a lot to tweak your site according to the current user demand and will give you an edge over many other sites.