“What am I getting out of this?”
This is probably one of the most common questions asked by business owners planning to pursue marketing and advertising campaigns to boost their brand in the ever-so-competitive market. With the billions of dollars spent every year on online and traditional advertising channels, it’s definitely a question worth asking.
Yes! You heard it right! Billions are spent each year on online and traditional advertising channels! Done take our word for it. Check out these stats:
- The global digital ad spending reached 170.5 billion U.S. dollars in 2015. (Source: Statista.com)
- U.S. Internet Ad Revenues reached $27.5 billion in the first half of 2015. (Source: WSJ.com)
- Online ad spend in the US is increasing by 67.4 billion dollars/ year. (Source: Wishpond.com)
- Paid search is grew from $19.7 billion in 2015 year. (Source: Marketingcharts.com)
- Over 40% marketers in the US increased spending on data-driven marketing in 2015. (Source: CMOCouncil.org)
Remember, an ineffective campaign can cost a company massive fortune in wasted budgets and a slew of missed opportunities. Unless business owners take steps to monitor and track the performance of their marketing and advertising campaigns, they have little way of knowing how much of their sales revenue is influenced by their marketing efforts.
This all sounds simple enough, but there is a danger of relying too much on overly simplistic data. If marketers focus too much on sales numbers, they may end up missing the fact that an ad or content marketing campaign is helping the company in several other tangible ways.
As the old and an extremely odd saying goes, there’s more than one way to skin a cat (though I really shudder to think of a time when everyone knew multiple ways to skin house pets). There’s certainly more than one way to measure your Return on Investment.
This is especially true for soft sale tactics such as content marketing and social media marketing. The actual return on the investment may come long after the initial view of the content and the benefit may be something beyond an immediate increase in sales, such as increased brand awareness or improved brand perception.
Additionally, different measures of return on investment can be used to create more effective and profitable advertising campaigns. The Internet allows for very precise advertising tactics, and marketers are now able to put the best possible content in front of their audience to engage and convert them into paying customers.
In short, using multiple measures of ROI can help paint a more accurate picture of what’s happening with a particular marketing campaign.
Here, we present to you eight exclusive yet easy to follow ways to measure ROI for your content marketing campaigns to help you see the forest from the trees when analyzing your data.
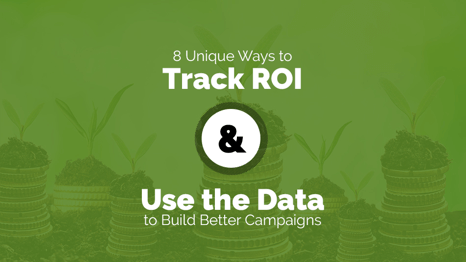
Download my Checklist to learn 8 Unique Ways to Track ROI and Use the Data to Build Better Campaigns
Start with a Direct ROI Calculation
A good place to start when trying to determine the value of your content is with a direct calculation of ROI. As mentioned earlier, you can’t rely solely on simplistic measurements. But don’t simply ignore them. Such data creates a good baseline that can be applied to multiple formats and platforms.
At the end of day, your business needs to generate revenue. So, a direct measurement of how much revenue is generated from the budget allotted for a particular content marketing method is always useful and easy to use for comparisons.
The most common way to do this is by tracking sales or the value of leads generated. In simple terms, your ROI is the percentage profit that you were able to make after deducting all the cost incurred on your campaign. Remember, just like return or profit that you earn on your bank account, your marketing ROI too is calculated as a percentage.
Let’s break down in a simple formula to help you understand it better.
Here’s the formula:
Total revenue generated from the investment minus the total cost incurred in the investment divided by the total cost of the investment multiplied by 100 = ROI.

Let’s take a hypothetical case:
Let’s assume that your:
- Total cost of investment for online ads was $1,000
- Total gains from your advertising investment was $1500
So, your ROI is 50% [1500-1000/1000 X 100].
For obvious reasons, this kind of simple calculation works best when it comes to breaking down complex sales figures into easy to understand profit and gain metrics. The value of these things is obvious and it’s easy to measure that.
Similarly, Facebook marketers too can measure their ROI with data (instead of sales numbers) in terms of engagement. This can be is number of likes, sign ups, etc. When you divide your total spend on promoting your brand on Facebook by the total number of engagement activities, you get a cost per engagement figure.

Here, the total spend is $54.33 and the total number of engagement actions is 51, so the cost-per-engagement is $1.07 (54.33/51 = 1.07).
A similar kind of calculation can be used for content marketing. For content marketing tactics like blogs, videos, podcasts, etc., the metrics are based on the number of clicks on the post, how many times it was shared, how long people stayed on the page, and so on.
These basic calculations of return on investment may be simple, but that isn’t a reason to shun them. Despite their banal nature, simple ROI measures are useful tools that business owners and marketers should use.
A direct calculation based on the total gains minus the total budget for each marketing campaign format divided by total dollars spent on the campaign can help marketers understand the kind of return they are getting from their marketing campaigns. This data proves helpful when deciding the marketing.
Social media and content marketers can also use sales numbers to determine a more traditional ROI. But the problem with this method is that the measurement can be somewhat primitive, unless the marketers take adequate precautions beforehand to capture the true amount of revenue generated.
Remember, 60% buyers are inspired to seek a product after reading content about it. So marketers can easily track the rise and fall in their sales figures based on when their content and posts go out. Or they can use specialty links or tracking pixels to understand if their marketing tactics are any good in terms of attracting sales.
Using direct calculations of ROI is a lot like using a slotted spoon to serve soup. You’ll get the biggest bits, but a lot of useful data will slip through the opening. But if you don’t have a ladle, a slotted spoon will do in a pinch.
Now that we’ve learned how to use the slotted spoon of ROI measures, it’s time to look for our ladle, so we can scoop up all the juicy bits of ROI data.
Use Google Analytics to Track Brand Awareness
No matter the method you choose, all measurements of ROI will involve data, and one of the easiest ways to get some basic data to work with is through Google Analytics. There are multiple ways to use Google’s free traffic tracker and other related tools to get data for ROI calculations, from tracking website visitors to monitoring the growth of a brand.
Data from Google Analytics can be very useful in determining the marketing ROI, especially from content marketing and social media marketing. While it’s possible to add conversion points to content, much of the value from content marketing comes from increased traffic and improved brand awareness.
Business owners and marketers should start by tracking which pieces of content (e.g. blog posts, infographics, videos, etc.) generate the most traffic. Though traffic may not relate directly to sales, there is a tremendous value in knowing what kind of content and headlines inspire target audience to click.

By examining the data closely, it’s possible to learn where content marketing dollars should be spent depending upon your business goals and objectives. Bloggers and news publishers can use the time on page metric to see what content keeps people engaged.
Retailers can calculate which content pages attract the highest ratio of visitors to complete a purchase. Even if this isn’t a direct measure of what page produces the greatest revenue, such calculation will help marketers zero in on the exact combination of content and incentives that can tempt people into making a purchase.

Data from Google can also be useful in measuring ROI in terms of brand awareness and brand perception. Brand awareness and brand perception can be very difficult and complex to track accurately. However, instead of spending thousands on long-term surveys and multiple focus groups, smart marketers can use keyword data to track and measure complex matrices including brand awareness and perception.
By using Google’s Keyword Planner tool, brands can see if there are more branded keyword searches for their company. In a broad sense, this can be used as a barometer for the amount of buzz a brand is generating. Over time, businesses should expect to see more searches for their brand as more people learn about it through various marketing tactics.

In fact, this quick measurement of brand awareness comes in handy for determining the return on investment from advertising campaigns. After most advertising or marketing campaign, business owners should expect to see some increase in their branded keyword searches.
A recent example of this can be seen by the advertising blitz used by FanDuel and Draftkings during the 2015 sports seasons. There massive TV ad campaigns let to a lot of people searching for the companies on Google or in app stores.
By analyzing traffic and brand awareness after each ad, it’s possible to determine which ads they used performed the best. Even when not spending billions on advertising, it’s good for business owners to do these kinds of analyses in order to determine multiple measures of ROI for judging a campaign.
Another way to use keywords as a tool for measuring ROI is to use slightly varied keyword phrases to tease out data on brand perception. Simply measuring the amount of branded keyword searches gives a measure of buzz generated. But buzz can be good or bad, so trying to determine the movement of brand perception is a vital measure to take.
If people already have a negative perception about a brand, it will show up in the way they search for information about the brand or topic. To continue with the fantasy football reference from before, FanDuel and Draftkings attracted a lot of unwanted attention from state regulators for all their advertising.
Many people who searched for information about fantasy sports were looking to see how they could get started, or if the apps were legitimate. But there were others who were searching for reasons the sites shouldn’t be allowed to operate.

FanDuel and Draftkings could easily measure the growth in positive or negative sentiment by watching the growth in branded keyword searches that include terms like “ban”, “illegal gambling”, “lawsuit” or “complaints”. Terms linked to positive sentiment would include “download”, “winnings”, “tips and tricks” and “starting”.
While there will always be some negative sentiment for every business or organization (well, you can’t please everyone), if the rate of growth for negative branded keyword searches outpace the growth of the positive ones, the brand will simply be left in the dust.
Google provides so much data that there are multitudes of ways to mash it up to create useful metrics for ROI. The key is to find the data that’s useful for your business and create a consistent way to track that data over time for your marketing and advertising campaigns.
Add Multiple Conversion Points on Site
Conversion is the highest leverage point for any business. But conversion isn’t that easy. Remember, not all your visitors will not go directly to your “Product Pages”, click the “Buy Now” button and make a purchase, the very first time they visit your site.
That’s why it’s important to ensure multiple conversion points to your site and measure the progress individually. Multiple conversion points are vital to the success of any content marketing strategy, or any soft selling tactic. The key is to keep people coming back long enough to the site for a conversion to happen.
It’s easy to track returning visitors in Google Analytics.

Remember, most shopping and business decisions don’t happen in single visit. By getting visitors to return to the site and making conversion easy for consumers, marketers can set up things up so that when the customer is ready to make a conversion, they are in the right place.
For example, if you’re using blogs to first draw consumers to your site. You may choose to promote RSS feed and send out email newsletter to keep your visitors updated about your new offering and lure them into coming back to your site.
These conversion points can are crucial to effectively strengthen the lead generation process. Also such conversion points make it easy for you to track the ROI of various pieces of content or marketing tactics easily.
Each conversion point is a step toward the final sale or referral, which makes them ideal ways to determine whether or not content is resonating well with the target audience.
But even before you think about setting multiple conversion points at your site, it makes sense to carefully mull over a few vital questions:
- Which pieces of content provide the highest number of email newsletter sign ups?
- What’s the rate of newsletter sign ups compared to number of visitors?
- What pieces of content generate most engagement (e.g. shares, comments, etc.)?
- What pieces of content lead to the most activity on social media?
Finding answers to these questions will definitely help you setup effective conversions points at your site, eventually helping you measure your ROI easily and effectively.
Set Smart Benchmark Goals for Online Ad Campaigns
Online ads have some basic forms of ROI built into their platforms. Clearly, if you know how much money is being spent on an ad campaign, and how much engagement, traffic or sales the ad produces, it’s a simple matter to get a direct understanding of your ROI.
However, you can go beyond simple calculations in order to learn more about what works and what doesn’t for their target audience. One way to do this is to set specific, measurable, attainable, relevant and timely goals for ad metrics.

Using benchmark goals as an additional way to measure ROI is extremely useful in cases where the ad doesn’t correlate to an easy-to-measure goal such as sales. For example, using the average cost per click of an ad campaign as a metric allows marketers to judge the effectiveness of their ads over the long term.
The average cost per click for a campaign varies based on the quality of the ad content. When dealing with the large budgets, decreasing the cost per click by just 5 to 10 cents can lead to hundreds of new leads every day.
And since ad content loses its appeal over time, measuring the average cost per click over time is a good way to know when it’s time to change up the content. This is important for large corporations planning long-term campaigns, where ads may seem productive, but are in reality declining in terms of productivity over time.
The point is that you need to move away from sales as the only metric for measuring the effectiveness of your ad campaigns. There are many steps from seeing an ad to the point of sale. Focusing too much on the last step can blind you from other opportunities to improve your ad content.

Remember, only 59% of ad impressions served across all consumer segments reach their intended audience. And that’s why besides tracking the average cost per click over time for a particular ad set, it makes sense for you to track the ads CPC in relation to similar ad sets. This will help you measure ad performance against a more objective standard.
Most online ad platforms have quantitative tools to let business owners know the average cost per click bid for a particular keyword or target audience. If you notice that your ad’s cost per click rate is growing more quickly (or declining more slowly) than the average, it’s a sign that your ad will not offer a great return on investment.
Create a Social Listening Dashboard
Social media marketing can be one of the most difficult places to measure ROI. Social networking sites such as Facebook, Twitter and LinkedIn all come with basic analytics, but it’s really difficult to turn social insights into actionable data.
For example, most social networks allow users to see how much reach or engagement an individual post gets, but that doesn’t directly correlate to more traditional goals such as increased sales and revenue.

This problem with social media marketing can be relatively hard to get around. Though there are a number of ways to get direct measurements from social media such as using tracking pixels on Facebook ads for retail products, sales from Promoted Pins on Pinterest, and sales through special hashtag programs on Twitter, these methods have limited use.
To make the matter worse, social media turf is being increasingly invaded by more and more businesses looking to reach out to their niche consumers. This means that now it costs more to reach the same number of people even the paid content. According to a study by Neilson Group, American B2B marketers alone will spend $100 billion on social media advertising per year by 2017.

A lot of social media activity happens away from ads or promoted content and marketers need a way to capture that data as well. One way to do that is to set up a social listening board to track consumer sentiment and social chatter about a brand or product.
Social listening boards work by using a hashtag and keyword trackers to see how often your brand or product is mentioned on various social media networks. For a simple illustration, if a business measures the number of time their brand is used a hashtag each week, they can chart when and by how much brand awareness is growing.

Marketers on Facebook can track their post reach and engagement figures over time to do a similar calculation. These charts can be used to measure the effectiveness of certain ad campaigns. If mentions increase more after one campaign than another, it suggest the former had a better ROI.

While it’s important to not become a slave to engagement on social media, noting, right from the increase in page likes to retweets, could be a good indicator about the effectiveness of the content shared through social media.
Keep in mind that social media has become mostly pay-to-play for most businesses owners. And the best way to gain substantial reach and engagement in the oversaturated social media marketplace now by paying for content promotion.
The difficulty of gaining direct measures from social media that can be used for ROI may be annoying, but it’s a frustration worth dealing with. Remember, social media is one of the most common ways for people to learn about new products and services. And that’s why it’s essential to find ways to track the effectiveness of your dollars that you’re spending to boost your brand through social media and content marketing.
Give Micro Surveys to Visitors
Though there are plenty of useful tools available for you to gather data from your visitors without having to ask them directly, sometimes it’s only way to get the information needed for ROI measurements.
This is especially true for situations if you’re trying to measure things like brand awareness or consumer perception. But how would you ask your customers about their experience about your brand without being too pushy? This is where micro surveys come to your rescue.
Micro surveys are a way to get vital data from your site visitors without too much trouble. As the name suggests, micro surveys are small questionnaires given to visitors who land up at your site. People agree by clicking on a pop up, and are then asked a few questions at some point during their browsing journey at your site.
The amount of useful data that can be gathered this way is sometimes staggering. Asking “Will you recommend [this product or service] to a friend?” or giving visitors a chance to rank their feelings about your brand can be more useful than traffic based analysis to determine the ROI for your marketing or advertising campaigns.
Here’s an example of Micro-survey by Virgin Trains. Look how smartly this survey finds out the customer sentiment without being too pushy.

Micro surveys may be less expensive than other methods for gauging consumer sentiment, but it often still requires incentive to get people to take them. Retailers can offer small coupons or discounts for those who complete the survey. This acts as both an incentive and another way to convert visitors into customers.
As with all things, the ease and convenience of micro surveys can lead to data skews that you should be aware of. For example, if someone comes to your site, and hates it completely, they probably won’t stop to fill out your survey.
This can lead to the results being more positive, due to the self-selecting audience, than they would be if you use a more formal survey. Formal surveys would get responses from a wider base of consumers and not just those who have somewhat positive feelings toward your site or company.
To compensate for this skew, you must use micro surveys regularly. Using the same survey method on multiple occasions would help you track the results over time. This shows whether or not sentiments are improving.
Here are just some of the many questions you can use on micro surveys to track your ROI:
- On a scale of 1 to 10, how likely are you to recommend this product or service to a friend?
- After visiting this site, what are your feelings about this brand or company? Very Negative, Negative, Neutral, Positive, or Very Positive.
- On a scale of 1 to 10, how easy was it to use this site to find what you need and accomplish what you needed to do?
- How did you first hear about this product, brand or service?
Using micro surveys is a great way to gather extremely valuable information directly from consumers and is something you must definitely consider using.
Use Specialty Data from ROI
It’s important for business owners and marketers to find as many ways as possible to track the productivity and return on investment for their marketing and advertising tactics. Not knowing what your results means that you’re flushing your money, efforts and time down the drain.
As mentioned earlier, the simplest ROI measures don’t account for all the different ways content marketing activities can help a business. Each time, we bring more actionable to the table, the more complete the picture becomes of how useful or effective a particular strategy is.
One way to understand the value of your content is by using specialty data as part of your ROI calculations. Thus far, we’ve focused on easy-to-obtain data, such as web traffic and engagement counters. However, by investing a little time and fortune into software, a whole new world of ROI calculations would be available for you.
Let’s consider a few ways in which form analytics can be used in ROI calculations. A good starting point is to look at the pieces of content that lead to most form completions. Forms are usually related to lead generation or sales activity, so finding the most effective content for getting completed forms is a valuable piece of information.
Form analytics software also allows marketers and business owners to drill down even further when examining the effectiveness of content (and forms). There are many steps from when someone starts filling up the form until finishing it. Looking at this data for patterns can be useful.
To illustrate, many businesses have optimal fields on their form to make it easier for visitors to only fill the information of their choice. Tracking which content has the highest rate of visitors offering optional information in forms shows which content has the greatest value for conversions.
Similarly, heatmap analysis can help you obtain greater insights on which pieces of content have the greatest value for your business. A heat map analysis uses data from visitors to determine which areas of a web page gets the most attention.
There would be some particular parts of your webpage that you would want visitors to focus on, such as the CTAs. Using a heatmap analysis can help determine what kind of content does the best job of getting people to notice the target area.

For example, consider the traditional “Shop Now” call-to-action button. A heatmap analysis would show what articles made people think about clicking on the call to action button. Even if they don’t click, it’s good to know which pieces of content fail entirely and which ones are close to achieving conversions.
Another place to look for ROI is in mobile app. Remember, mobile apps account for 52% of all time spent on online digital media. According to Nielsen, 86% of US brands plan to increase spending on mobile advertising in 2016. An additional 10 percent plan to maintain their current spending levels.

Given this data, it’s no rocket science to understand why gathering data from mobile app insights is crucial. For starters, it can be help you determine ROI for a particular the money spent on the app.
Depending on the purpose of the app, there are a few things that marketers would want to measure to determine their ROI. For example, shopping apps can see which product pages generate the most clicks, gets the most reviews, or provide the highest conversion rates.

Apps for blogs, magazines and other content publishers can use mobile app data to determine which content generates the longest app sessions, which ones lead to more clicks, and which ones show the most activity between the app and other channels like the main site or social media platforms.
This data can be useful outside the app because the same products and content should perform equally well on the main site. The fact that apps can provide specialized data that can help all other campaigns is a benefit business owners should consider when deciding whether or not they want to use an app.
According to a recent study from Forrester Research, one in five (22 percent) of US small businesses have mobile apps and that number is growing. This shows that using app data to measure ROI and plan better marketing campaigns isn’t just for big brands.
Another reason for businesses to focus on app data is that there’s evidence that more businesses will be joining the ever-crowded market for mobile marketing. Businesses that are already using an app can use their ROI analysis to make better ads to outshine the competition.
8. Segment Audiences for More Detailed Measurements – Business owners and marketers can be somewhat like children when it comes to tools for analytics and data online. There can be a tendency to move on to the newest, shiniest tool before fully taking the advantage of the tools currently at their disposal. This can be unfortunate, because there may be an ROI data gold mine just waiting to be tapped.

The point of using multiple measures of ROI is that they allow decisions makers to better understand their audience. Segmenting existing data to learn more about specific subsets of the target audience can have the same benefit.
Being able to segment audiences for ROI measurements is essential for efficient and effective online marketing. There are 2.8 billion people online worldwide, according to recent estimates. This means the audience of the internet is too large to lump everyone into one group and to spend budgets wisely.
For example, a particular piece of content may have an overall conversion rate of 8%. But that may be split between a 1% conversion rate for women and a 7% conversion rate for men. Knowing this would allow the marketer to spend the ad budget targeting male consumers with the ad.
Segmentation can come in many forms. And it’s likely that many business owners already do some data segmentation or have the ability to do so with the tools they already use. Some of the most common groupings are for things like demographics, psychographics, geographic, or behaviors.

A good place to start measuring ROI with segmentation is to use common groupings to see how the content is performing with different genders, ages, employment and race. Doing so will let you know if and how to best use the content to appeal to different parts of the target audience.
You can also use this data to decide which ads are worth keeping or should get a bigger budget. Continuing the example from above, if women were the main buyers of the product in the ad, the 8% conversion rate is pointless is the people most likely to click aren’t really buying your products.
Demographic data can provide some of the most powerful tools for creating ROI analyses that can be used for better targeting. For example, marketers can segment data from a series of A/B tests to determine which factors work best for each demographic. Then, use that data to create more effective internet and social media ads.
There’s data to suggest that creating more individualized campaigns will be a hallmark of the New Year. A report from Hybris stated that 91% US marketers plan to prioritize improving customer experience through personalization in 2016.
How TruConversion Can Help?
TruConversions is innovative platform that makes it easy for businesses helps businesses with tracking conversions at multiple stages of the buying process. Adding data like form analytics and heatmap analysis can make it easier to make wise decisions on marketing and advertising budgets.
If you’re still wondering what exactly is TruConversion? It is platform that gives you access to all the tools you need to grow your business, optimize your conversion rates and improve sales.

From Heatmaps to Visitor Session Recordings and from Conversion funnels to Micro Surveys, TruConversion is one complete application that helps you understand what your visitors do on your website and why they’re leaving, without having to run from pillar to post. But what sets this application apart from other similar suites is its compatibility with all major third-party applications such as Google Analytics, Kissmetrics, Crazy Egg, Survey Money, etc.
Conclusions – Every year, business owners spend billions of dollars on creating content and ads to sway public opinion and inspire consumers to buy. It is vital that companies create some way to measure their return on investment, lest they risk wasting ad budgets and missing valuable opportunities.
Most marketers use basic calculations of ROI to determine the revenue or value generated from ads. But as has been discussed throughout this article, basic measures of ROI (or anything for that matter) leaves a lot of important information on the table that may be necessary for making informed decisions.
Using multiple measures of ROI helps prevent marketers from throwing the baby out with the bathwater (who thinks of these sayings). If marketers only rely on only on sales to determine content efficacy, then a lot of content that would be good with some minor modifications could get thrown out.
All forms of advertising and marketing are nuanced, and the value gained can’t be solely measured by sales numbers. There are many steps in the sales process, and multiple measures of ROI shows which pieces of content and advertising is most effective at each step.
To reuse a metaphor from earlier, advertising and marketing is a picture where each piece of ROI data makes the image more true to life. And it’s only by using multiple measures of ROI that we get a good understanding on the effectiveness of ads, social media marketing, blogs, emails and other marketing tactics.
The quality of ROI measurements depends directly on the quality of data used to make the calculations. Furthermore, bringing in specialty data adds more color and depth to the picture created, than ones relying on more traditional data sources.
When looking for data to use for measuring returns on investment, business owners and marketers should start with free tools like Google Analytics, but with time, they need to look for more exotic forms of data to capture points of views that would be missed otherwise.
Key Takeaways:
- Start with a Direct ROI Calculation. Total gains minus total cost divided total cost multiplied by 100 is ROI. ROI is the percentage profit that you were able to make after deducting all the cost incurred on your campaign.
- Use Google Analytics to track brand awareness. There are multiple ways to use Google’s free traffic tracker and other related tools to get data for ROI calculations, from tracking website visitors to monitoring the growth of a brand.
- Add multiple conversion points to your site and measure the progress individually. Ensure multiple conversion points to your site and measure the progress individually.
- Set smart benchmark goals for online Ad campaigns. These goals will help you understand where your money is being spent, and how much engagement, traffic or sales the ad produces are you able to create.
- Create a social listening dashboard. Use a hashtag and keyword trackers to see how often your brand or product is mentioned on various social media networks.
- Explore micro surveys to your advantage to collect vital data directly from your clients. It will help you finds out the customer sentiment without being too pushy.
- Heatmap analysis can help you obtain greater insights on which pieces of content have the greatest value for your business. Don’t forget to analyze your mobile app data, if you’re a mobile app based business.
- Use segmentation strategies to make your marketing campaign more effective and productive. You marketers can segment data from a series of A/B tests to determine which factors work best for each demographic.