Since we’ve launched TruConversion I’ve been getting a lot of questions about how to use customer behavior analytics! When you’re so close to a product, it’s easy to take for granted that people just don’t know 1) how to use it and 2) how to use it best!
In response to this we started creating more ‘How-To’ videos in our Resource Center and keeping an up-to-date help center. This was a great way for us to help you use the product but never tells you when and why to use TruConversion.
Well, that’s all about to change!
Today, you’re going to learn why customer behavior analytics matter and the EXACT process I use to apply these learnings on my own marketing campaigns.
Here’s the best part: There are only 4 steps you need to follow to get the useful customer behavior data that is going to really move the needle.
Contents
Step 1: Have a purpose
When you start digging into data you should be trying to answer specific questions. You shouldn’t be looking at your analytics reports and hoping to have some ‘Aha Moment’. Can that happen? Sure. But that’s more luck than analysis and you can’t run your business on luck.
This is why you need to have a specific purpose when you set your campaigns up and there are a few ways to do it.
Likely when you signed up for TruConversion you had a few pages you wanted to take a look at…and that’s great!
Hopefully you already have some quantitative data and you are trying to figure out what’s going on from the user standpoint. However, after those first heatmaps or recordings, where do you go next?
Or worse, what if you didn’t really have a page in mind when you signed up?
Here’s what you do:
Create a funnel using Funnel analytics to track if/when people convert (and more important if/when they don’t).
We make it really easy for you to set up your funnels you can use our standard features and use page level targeting…
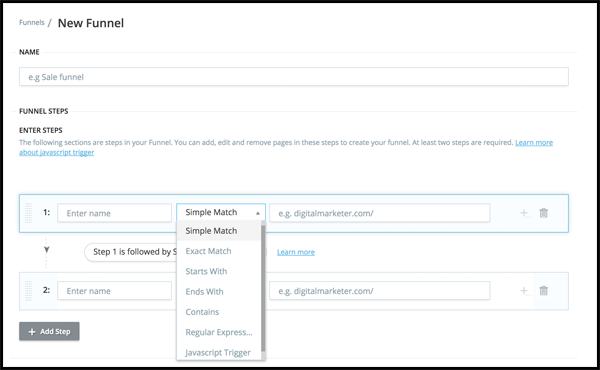
OR you could get a little more advanced to use event based triggers.
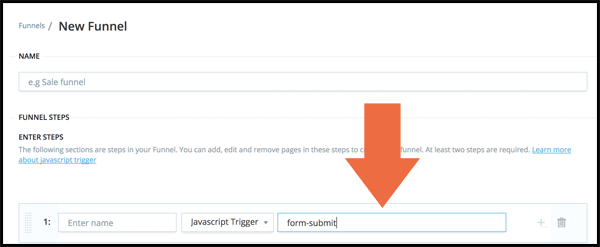
We added this feature for sites with conversion events that happen on a single URL, e.g., AJAX forms, progressive forms, etc…
Knowing your drop-off points will tell you the pages that need a little love.
We also wanted to make it a little easier for you to get the most relevant user data at the points where it can actually make a difference.
Now when you set up your funnels you can set minimum conversion rates per step. If your conversion rate dips below this rate, then we’ll automatically set a heatmap and recording up for you!
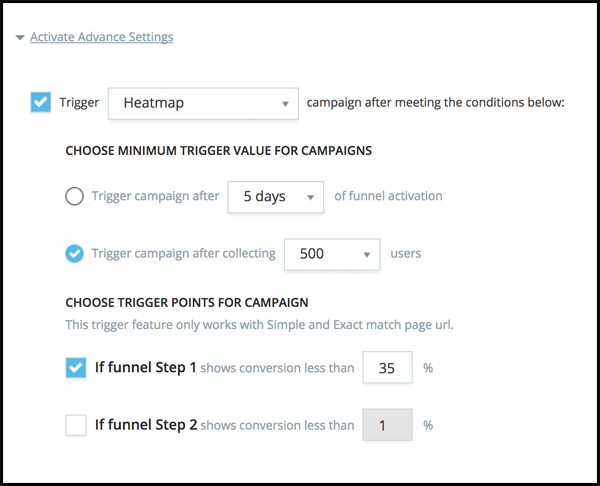
This way you don’t have to think about creating these reports and you’re getting the data when it matters most, in that immediate moment (not a few days later when you can finally set up the report).
After you’ve gathered some data you’re going to want to break it down into more actionable data sets. When you open the report you are getting an average of all users from all devices. While this is a useful indicating data set, you’re going to want to dig down to find more opportunity!.
In most cases I recommend using our advanced filters to look at how people are converting by device for each funnel you create. Here’s why:

This funnel is converting at 35.61% which is a little below our ideal conversion rate of 40%. Before we start making some major assumptions about the page, we should dig into the conversion rate by device to see if there is a specific place to focus our efforts.
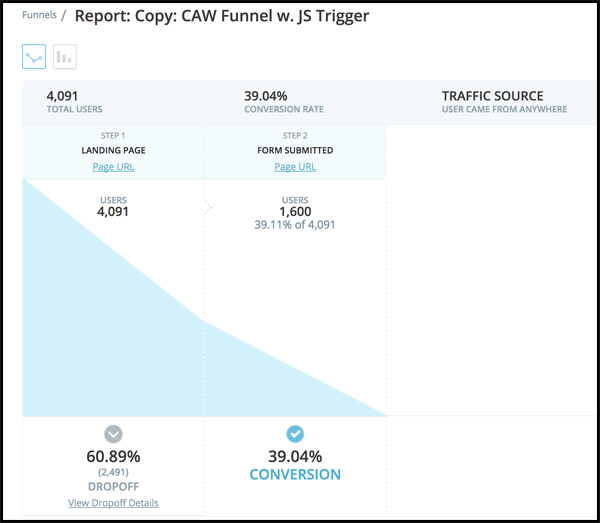
Our desktop visitors are converting much closer to our benchmark conversion rate. However, that’s a little different for our mobile conversion rate…
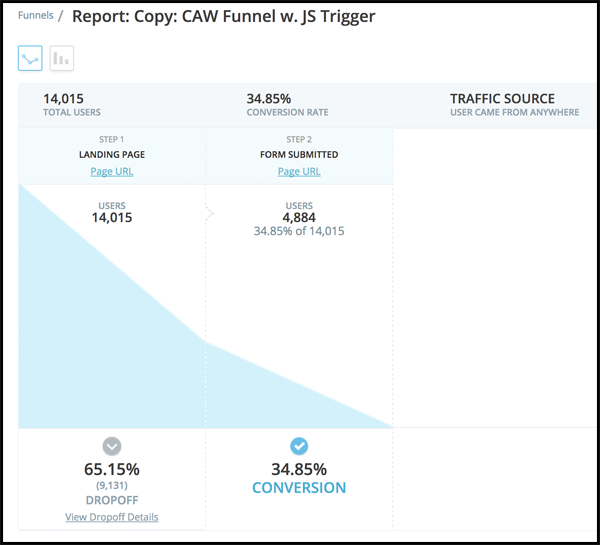
Mobile conversion rates are both below the average conversion rate for this funnel and below our benchmark conversion rate. With this information I know I’ll need to pay special attention to the mobile heatmaps and to the mobile form analytics. Instead of spending time on heatmaps for the desktop variant I can jump straight to the mobile view to identify what is keeping our mobile conversion rates down.
If you are constantly tracking your funnels using the Funnel Analytics tool, you’ll have a continuous stream of optimization opportunities.
Step 2: Set up a Customer Behavior Heatmap
For those of you who don’t know what a heatmap is, it is a visual representation of where your visitor clicks, scrolls, & moves their mouse. With TruConversion you can see all of these reports on all devices.
We also let you filter this data and redraw your heatmap based on those filters (so you an see if the average visitor performs differently than visitors from your paid traffic campaigns).
I’m sure most of you skipped Step 1 when you first started using this tool (or other tools like this). I get it, that’s fine! You have a page you want to take a look at (hopefully based off of data from other sources).
It’s also worth noting there are other times when you should just set up a heatmap:
1. Campaign Launch
2. In response to Funnel Analytics (or other quantitative data points)
3. Site Redesign
If you start making it a habit to set up a heatmap for all new campaigns and when you launch a redesign you’ll have more useful data to work with!
So, you’ve set your heatmap on your key pages. Now what? I’m sure you’re looking to get something more out of these pages than some pretty colors.
This all comes back to having a purpose, if you don’t have a reason to put a heatmap on the page then it won’t help you one bit.
Here are a few boiler plate questions to ask when you’re looking at your heatmap:
1. Are they clicking where they should?
2. Are they seeing our most compelling content?
3. How long does it take them to click the CTA?
4. Are visitors clicking ‘unclickable’ content?
5. Are visitors not clicking ‘clickable’ content?
6. Are people clicking other visuals instead of the CTA?
Let’s give this a try:

1. Are they clicking where they should?
1a. Yes, the majority of visitors (32%) are clicking the main CTA button.
2. Are they seeing our most compelling content?
2a. As a relatively short page, 50% of the people get to the ‘Here are some facts about the book’ section. I also noticed that people are clicking the ‘Look Inside’ button.
3. How long does it take them to click the CTA?
3a. 37% of the audience click the CTA button wishing 10 seconds.
4. Are visitors clicking ‘unclickable’ content?
4a. A small percentage of visitors are clicking the book image.
5. Are visitors not clicking ‘clickable’ content?
5a. No. Overall people are clicking the content that is meant to be clicked.
6. Are people clicking other visuals instead of the CTA?
6a. A lot of visitors are clicking the navigation at the top which could cause click fatigue.
Takeaways:
This page is relatively well designed and it meets the expectations of the visitors. One minor tweak would be adding a CTA button on the ‘Look Inside’ overlay. If you want to read the full audit of this page, check it out here.
If you start asking these questions, you’re going to get way more out of your heatmaps. I also recommend giving this post a read so you can learn how to get the most out of your heatmap reports.
Step 2.5: Set up form analytics*
I know that I said there were only 4 steps to this guide and that’s because not all pages have forms on them. However, if you set up a heatmap on a page with a form I HIGHLY RECOMMEND tracking the form analytics!
This goes for lead generation landing pages, carts, check out processes, or all pages with an input field.
Setting up form analytics takes less than a minute, but this data is a game changer. This is hands down the dark horse of all the TruConversion reports. This single report will provide tons of actionable data, has a short see up time, and is relatively easy to analyze.
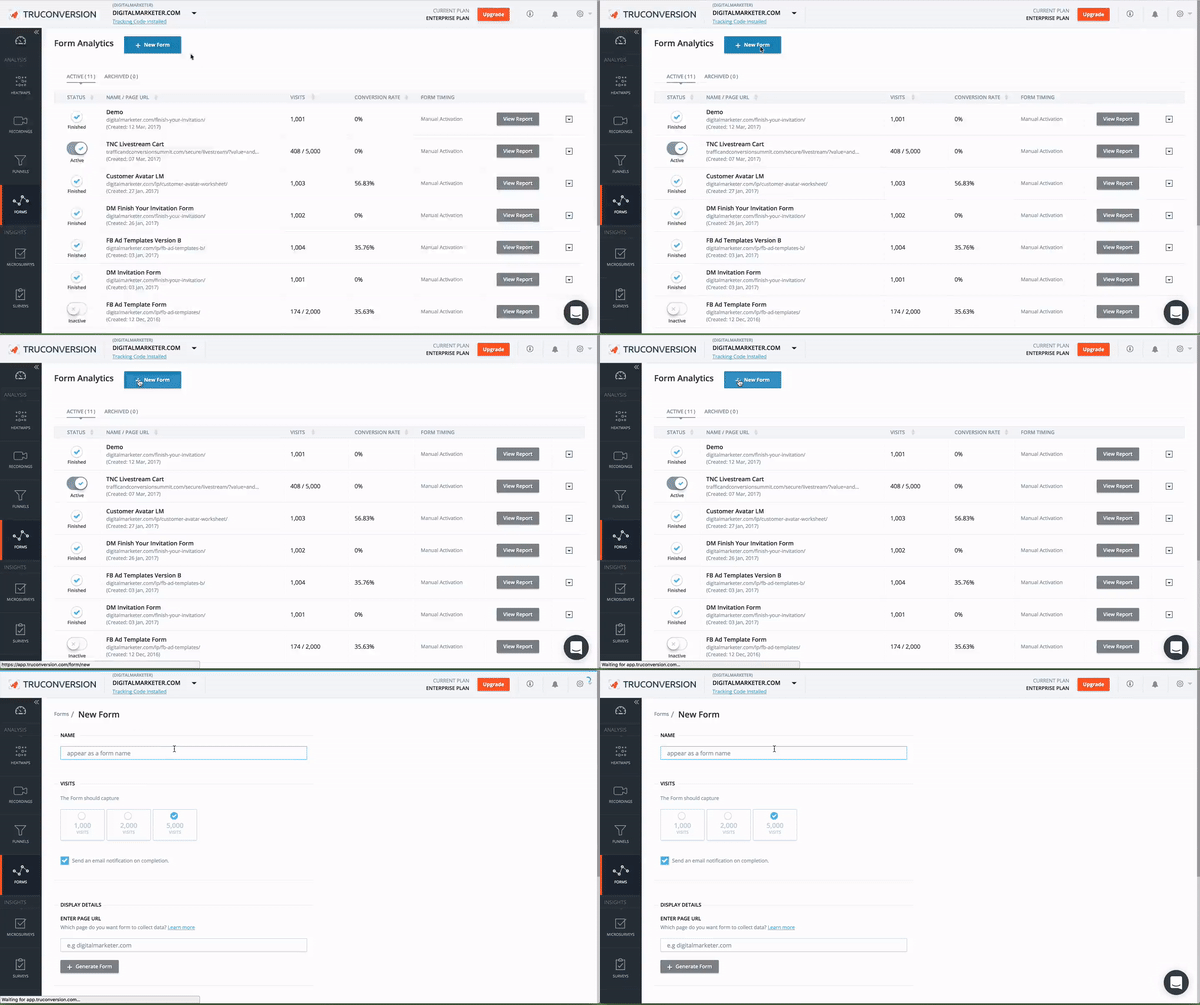
This single report will tell you:
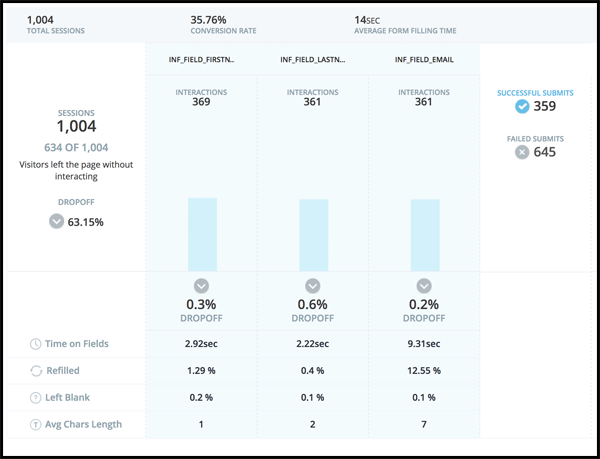
Form conversion rate – this is always a useful number to know. This is telling you how many people submitted the form.
Time spent on the form – A super useful piece of information. If you have a relatively short form, but people are spending minutes on it then you have some major usability issues that need to be addressed.
Time spent on each field – If your time spent on form is high, you’ll see which fields are causing the biggest slow down.
Field refill rate – when visitors have to refill forms, they get frustrated. If you have particular fields that are refilled often you might need to add some example text or auto field formatting to make sure they don’t have to retype.
Average character length – If you have a phone number field and it’s less than 9 characters, well you aren’t getting real phone numbers.
Percentage left blank – If people can still submit a form with blank fields, that means you have optional fields. If you have optional fields you should just get rid of them :).
Once you’ve gathered some form data, I recommend the same thing I said during the funnel analytics analysis: filter the data by device. I used this process for a form on DigitalMarketer and the results were VERY surprising.
The short story here is that our mobile experience was lackluster and the awful time spent on the email field was a prime optimization spot. You can find out exactly what we did and how you can apply this learning at your company in this case study.
Step 3: Set Up Customer Behavior Recordings
Session recordings are a great way to get a detailed account for how individuals use a specific page or set of pages. When you set these up, you want to do your due diligence and ONLY try to get recordings that matter.
This is the #1 reason why we don’t have a switch for you to record every page at once. If you’re recording everything, then you’re really recording nothing and that goes against rule 1: have a purpose.
So how can I get the right recordings? Easy! Follow these steps and you’ll avoid wasting your time with recordings that just don’t matter.
1. Use more than just page targeting.
Sure you want to start recording a page, but do you really want to see how EVERY person is acting? Of course you don’t, that would take too much time and you wouldn’t learn a darn thing.
However, you can set element triggers to only record people who take a particular action on the page, e.g., clicked a button.
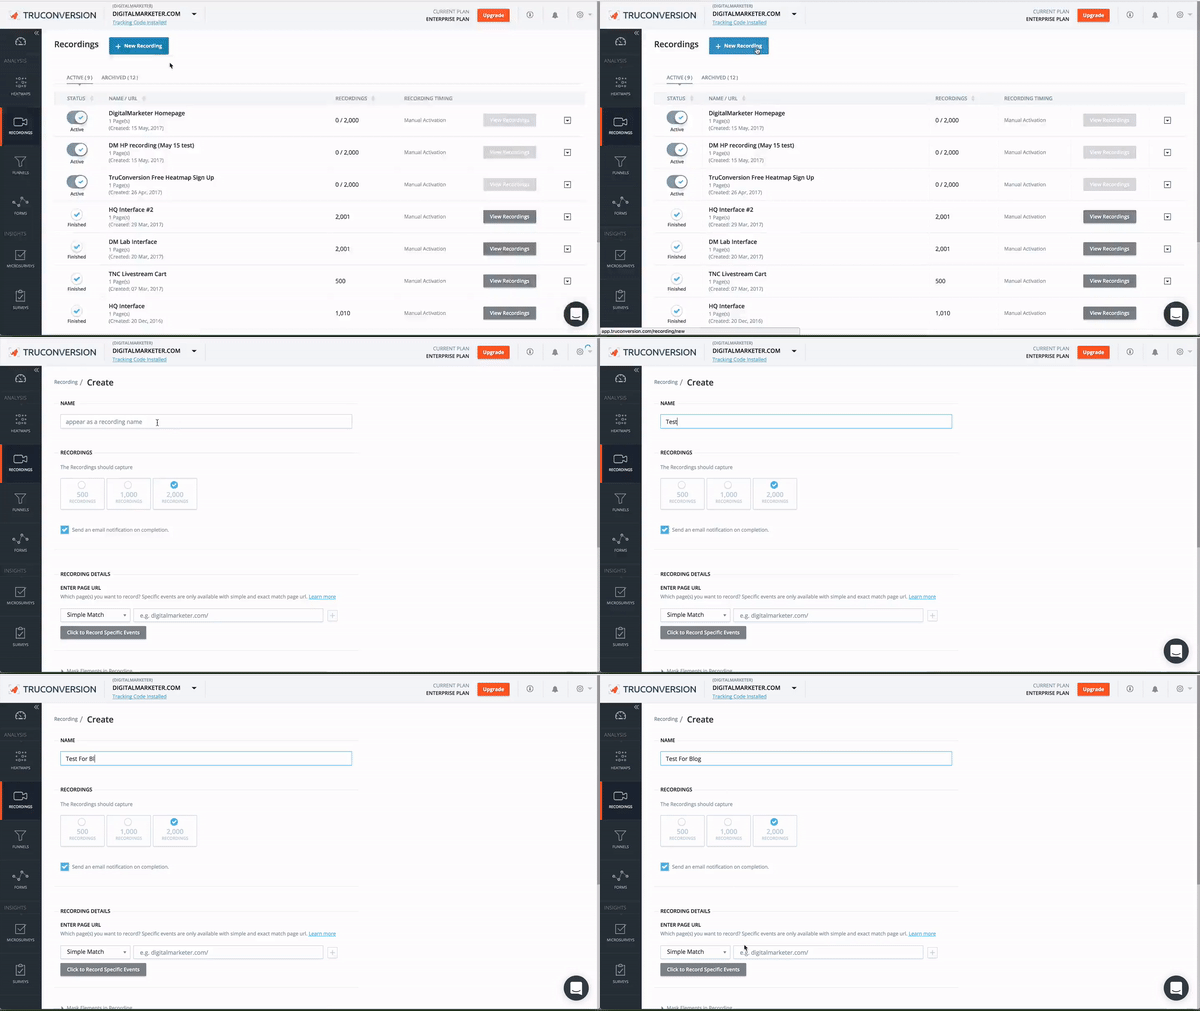
After you’ve picked your page and selected your unique element you just need to let those recordings populate.
2. Filter your recordings by device
Simply put, people act differently on different devices. You’re going to want to see how people interact with your site from different devices. You’ve likely overlooked some aspect of the mobile experience and you’ll notice this immediately.
3. Filter out people who leave within 30 seconds
By filtering out the people who spent less than 30 seconds on the page you’re really filtering out the people who ‘bounced’. This gives you more recordings of people who are at the very least intrigued with your offering and are in the decision process.
These recordings will point out the content that makes a difference and potential conversion barriers for interested visitors.
4. Filter out people who stay more than 30 seconds
This is just the opposite report! You’ll get to see the ‘bounce’ visitor’s behavior and can make tweaks accordingly.
5. Filter by # of pages
This is a good report to use if you used button clicks as your unique page trigger. We all know that just because they clicked a button doesn’t mean they submitted a form (or even made it to the next page). By requiring that there is more than one page view in the session, you’ll see people who actually clicked through and converted.
In general, I always opt to run heatmaps before I start running session recordings. I do this for one very simple reason:
TO SAVE TIME
Session recordings take a lot of time to analyze!
Even if you followed all the things I listed, you still have to put in all the work to dig through session recordings.
Ideally you should set your filters and then block your time accordingly (you might want to get some popcorn…you’ll be there awhile).
Here are a few tips that should see you some time:
- Frantic Mouse Movement Or Clicks = Angry Customer
- Quick Vertical scrolls in opposite directions = Looking for something specific
- Sharp movement to the top corner = about to exit (look at where this movement starts)
- Movement following copy = reading/engaged
- Suddenly no movement = bathroom break :p
Step 4: Use Customer Behavior Feedback Tools
When we launched the customer behavior analytics tool we had an internal debate to include the micro survey and survey feedback tools. We didn’t have this debate because they were an ‘add on’ tool or an ‘afterthought’, quite the opposite a lot of our development time went into the advanced trigger functions, integrations, and advanced functionality in each tool.
We debated launching these because feedback tools, as we define them, are inherently flawed. We believe the best type of Customer Behavior Analytics is passive user data.
Passive user data is data you gather when your subject is unaware they are in a observed environment.
Feedback tools are not passive data, they are active user data; or when the subject is aware they are in an observed environment.
When people know they’re being observed, they act very differently than when they don’t know they’re being observed. If you have the time, I’d recommend reading this post so you can see exactly what I mean.
Obviously we did add the feedback tools and the data is super useful, if you set them up correctly. So here’s how!
1. Stick to factual questions, i.e., avoid interpretive responses.
If you are polling your audience to find out how much traffic they get don’t do this:
Q: How much monthly traffic do you get?
a. High Traffic
b. Moderate Traffic
c. Low Traffic
This leaves each response up to the interpretation of the reader, which is a bad thing. Instead you should ask for specifics
Q1: How much monthly traffic do you get?
a) More than 500k/month
b) 100k-500k/month
c) 10k-100k/month
d) Less than 10k/month
When you ask like this, then you’re going to get clear cut data that isn’t subject to interpretation.
Remember when you write polls with pre defined answers, the answers you select are just as important as the questions you ask.
2. Use advanced targeting
Don’t show your surveys to just anyone, you want to show it to the right people. For both surveys and micro surveys we let you pick where you want the invitations to trigger and when they trigger.
With TruConversion you can choose from all kinds of different survey triggers such as:
– Page URL
– Device
– Time on page
– Scrolled down the page
– About to abandon the page
– Referring source
So instead of doing the ‘spray and pray’ method, have some intent. This may reduce the number of responses, but it will increase the number of useful responses.
If you’re just getting started with feedback tools, here’s a great resource for where you should trigger them and the questions to ask.
3. Reduce survey questions
When you create a long form survey, you generally start with demographic-centric questions. You can cut down on those kinds of questions early on by relying on the tool to gather things like geo region, operating system, device, and browser.
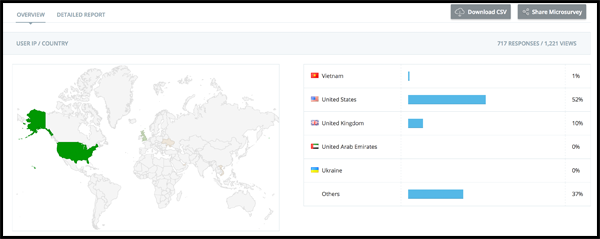
Cutting these types of questions out let’s you ask the more important demographic questions and then let’s you get to the more import questions you want them to spend time on!
Protip: make sure to run surveys in conjunction with other reports to verify the actions. Remember a visitor acts very differently than how they report they will act.
If you’ve made it this far you now know how to use Customer Behavior Analytics as a part of your optimization program. To summarize:
1. Have a clear goal and purpose. Ideally you’d use Funnel Analytics to continuously identify optimization areas.
2. Use heatmaps to get an understanding of your visitor’s behavior at a glance. Make sure to ask the 6 heatmap questions while analyzing.
3. If your page has a form, always track form analytics.
4. Use session recordings if you need a more detailed understanding of you customer. this will help you identify user issues that aren’t ‘click’ related.
5. Use feedback tools (in conjunction with other reports) to figure out what your visitor wants.
You can’t do any of this without TruConversion, so if you aren’t using it yet request your invitation today.
